Begin Again: A Marketing Plan for 2025
January 3, 2025

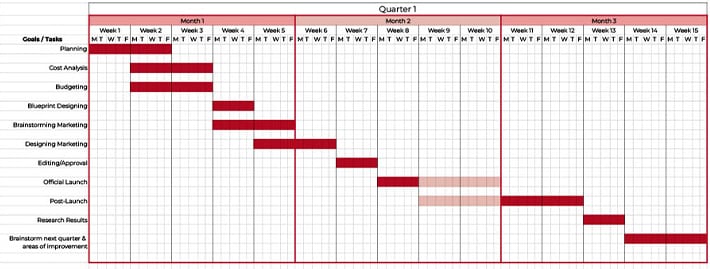
Tullian Tchividjian once said: “to progress is always to begin again.” Whether you’re still reeling from 2024’s roaring successes or chalking the last 12 months up to a series of learning curves, 2025 is your fresh start. Here’s a chance to look at your marketing and web development goals and map out the journey to get there. The key? Begin again. Start with the end goal in mind, and structure each effort to get you closer to that destination. Let’s use a Gantt chart to format your marketing calendar.
Start With a Chart
You might not be a linear-thinker. That’s okay – you don’t necessarily have to be. But most people respond to visuals. At JamboJon, we love a good chart! Let us walk you through one of the best tools for business owners as we approach the new year: a Gantt chart. Far from being just a fancy spreadsheet, a Gantt chart visually organizes your goals, tasks, and deadlines to help you stay on track. A productive year is right around the corner.
Step 1: Define Your Destination.
Alice, in her fictional adventures in Wonderland, asks the Cheshire Cat which way she should go. He answers, “That depends a good deal on where you want to get to” otherwise, “It doesn’t much matter which way you go” (*Lewis, 1832-1898). Before plotting anything on your chart, get crystal clear about where you want to be at the end of the year.
- Do you want to boost your website traffic by 50%?
- Launch a new product in Q3?
- Triple your email list?
Begin with the end in mind. Don’t hold back! Start with your big picture goals, and dream big! Write it down. Once you have your overarching objectives, break each down into specific, measurable outcomes.
For example, “Boost website traffic by 50%” could break down into:
- Increase blog posts to twice a week
- Run a monthly ad campaign
- Host one webinar per quarter
These details lay the foundation of your Gantt chart.
*Carroll, Lewis, 1832-1898. Alice's Adventures in Wonderland. Peterborough, Ont.: Broadview Press, 2000
Step 2: Plot Your Milestone
Now that you know your destination, set key milestones along the way. Think of these as the major landmarks on your journey.
- Quarterly Focus Areas: What themes or campaigns will dominate each quarter? For instance, Q1 might focus on rebranding, Q2 on building audience engagement, Q3 on launching a product, and Q4 on holiday promotions.
- Promotional Events: Identify the dates for major sales, product launches, or marketing campaigns that align with your goals. Anchor these on your chart.
Step 3: Work Backward to Build the Timeline
Ah, now that those milestones found a place on the chart, think like an explorer plotting a trail: start at the destination and reverse-engineer the journey. Break down the work needed for each event and campaign. What are the actionable steps that build towards each major milestone?
- What needs to happen the month before the big milestone?
- What tasks must be done six months before?
- Who will handle each step, and when will they need to start?

For example, a Black Friday campaign in November might require:
October: Finalizing ad creative and scheduling campaigns.
September: Gathering analytics and refining messaging based on past campaigns.
August: Developing landing pages and setting up email funnels.
Be sure to include buffer time to account for unexpected delays. By planning backwards, you’ll ensure nothing falls through the cracks and that each step blends seamlessly into the next.
Step 4: Layer in Recurring Activities
While your Gantt chart features key focus campaigns, don’t forget the ongoing tasks that will keep your marketing machine humming. Add layers for:
- Weekly blog posts or newsletters
- Monthly SEO check-ins
- Regular social media content creation
Represent these tasks visually so they don’t get lost in the shuffle when you’re focused on larger goals.

Step 5: Stay Flexible and Adapt
No map is perfect. A Gantt chart is a living, breathing document that allows you to see the big picture while constantly adjusting the details. If new opportunities arise or you experience unforeseen challenges, you can shift timelines or reallocate resources without losing sight of your goals.
In April 1970, Apollo 13 launched from the Kennedy Space Center with a plan to land on the moon for the third time in US history. A massive milestone, for sure. Only two days into the mission, an explosion within the module altered that original plan, dramatically changing the goals and timelines. Instead of aiming for a luxurious 33-hour exploration of the moon, they had to adapt and reevaluate.
- How much oxygen was left?
- How much power could they muster from a damaged ship if they shut off all nonessential systems?
- Could they fit a “square peg into a round hole?”

While the Apollo 13’s “successful failure” might seem like an overly dramatic life-or-death comparison, your business might require a lifeline as well. Check in with your chart regularly, adjust as needed, and use it to hold yourself (and your team) accountable. Assign tasks, give each a hard deadline, set clear expectations, and create visibility so everyone understands their role in the bigger picture.
Bonus Tip: Any Industry Can Benefit
Whether you’re a YouTuber dropping a significant amount of content online each day, or a motivational speaker who plans annual retreats for thousands of guests, you need organization. You and your team need direction and accountability. Why not make it visual?
Start Your Adventure
2025 is your blank canvas. Download this FREE PDF to begin crafting a marketing campaign with the end in mind. Chart a course that keeps you focused and productive. You won’t need to wonder how to get where you’re going. You know how to adjust along the way.
Ready to take the first step? Start brainstorming your big ideas and mapping out a path to reach them. If you need any guidance along the way, our chart-loving gurus at JamboJon are here to help.
Let’s make 2025 the year you conquer new frontiers . . . and begin again.


